High-Tech Seafloor Mapping Is Finding Surprising Structures Everywhere

Giant coral towers, vast reefs and other formations are captivating explorers

REEF TOWER
SOUTH PACIFIC, 50 MILES EAST OF CAPE YORK PENINSULA, AUSTRALIA Scientists at James Cook University in Australia were charting underwater habitats just beyond the northern end of the Great Barrier Reef using multibeam sonar when they came on a freestanding coral reef tower 1,640 feet tall—taller than the Empire State Building. The base of the wedge, shaped like a shark fin, is almost a mile across, and the tip is only 130 feet below the sea surface. Subsequent dives by a remotely operated vehicle showed the tower was teeming with fish and exhibited no signs of the coral bleaching that has tormented the Great Barrier Reef.

Join Our Community of Science Lovers!

Oceanographers are fond of saying that we know more about the moon's surface than we do about Earth's seafloor. It's true. As of 2017, only 6 percent of the global seabed had been mapped, typically by ships with sonar instruments sailing back and forth in straight lines across a local section of sea.

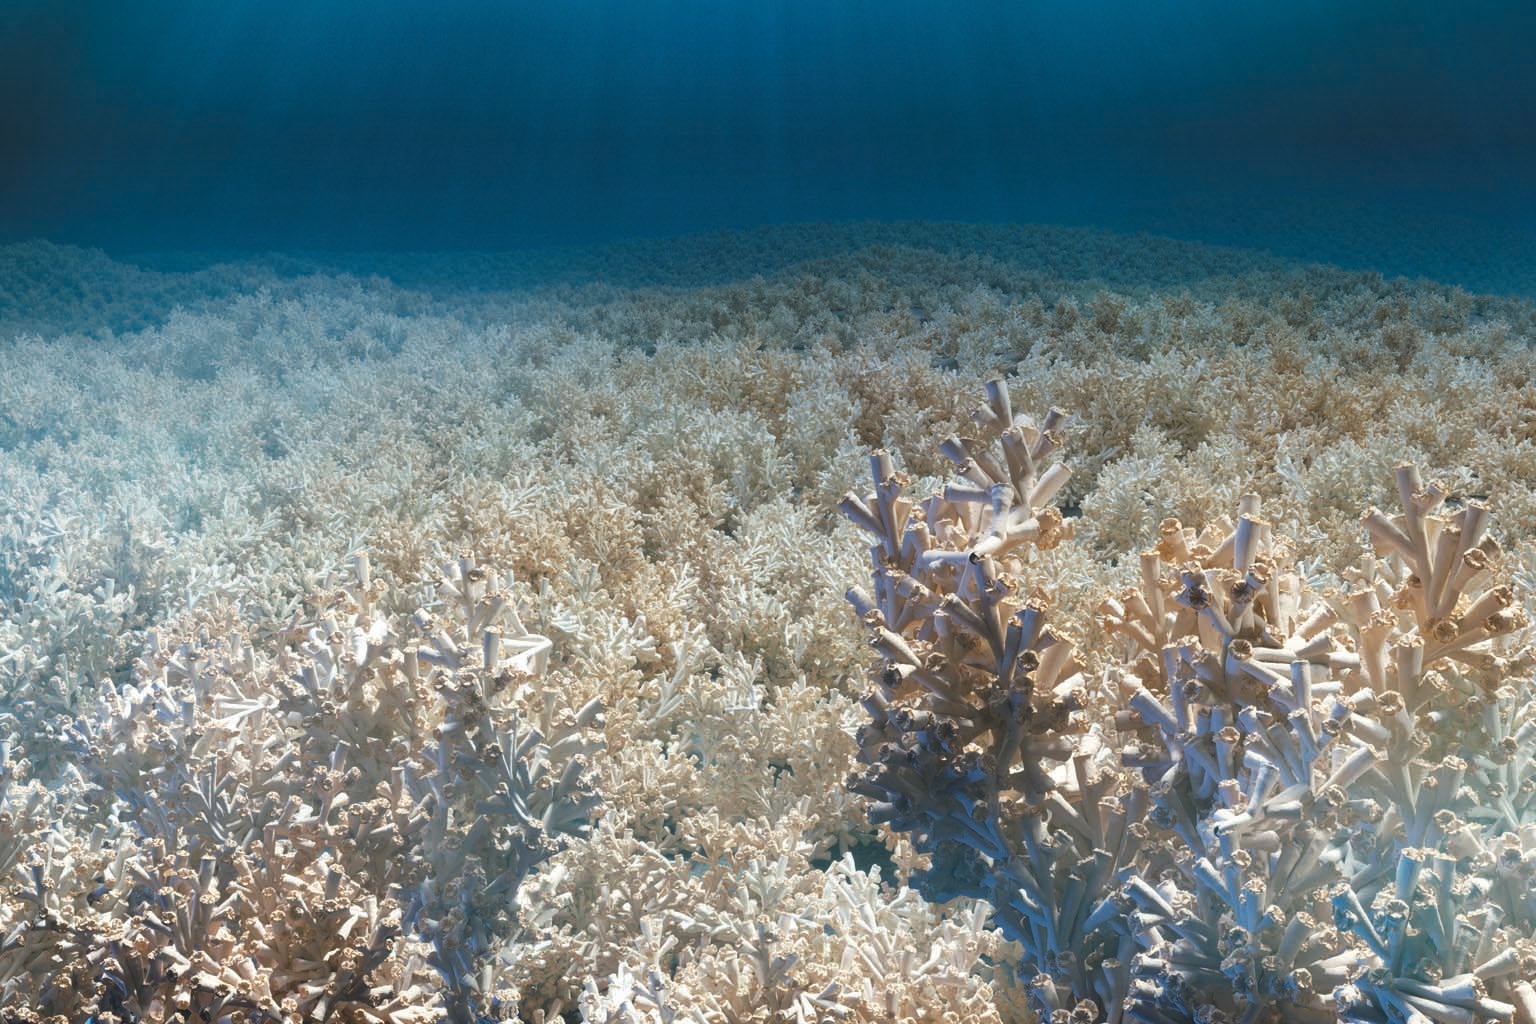
MILLION MOUNDS CORAL PROVINCE
NORTH ATLANTIC, 100 MILES EAST OF GEORGIA, U.S.
Investigators at the National Oceanic and Atmospheric Administration have finished mapping the “million mounds” deep-sea province. Thousands of coral mounds, each 30 to 300 feet high, blanket 11,000 square miles of ocean floor, making it the largest deep-sea coral ecosystem ever discovered. At a depth of 2,000 to 2,600 feet, the seafloor receives no sunlight, so the white corals don’t house symbiotic algae that give shallow reefs their color. When old corals in the mounds die, their skeletons provide the foundation for new corals; some mounds have been growing for thousands of years.

Credit: Maciej Frolow

But since then, nations have become eager to chart the seafloor within their own “exclusive economic zones,” which reach 200 nautical miles from their shores, in part to look for critical minerals they can scrape up using big mining machines. The other push is Seabed 2030—an effort to map Earth's entire seafloor by 2030, run jointly by the Nippon Foundation and the nonprofit General Bathymetric Chart of the Oceans.


On supporting science journalism

If you're enjoying this article, consider supporting our award-winning journalism by subscribing. By purchasing a subscription you are helping to ensure the future of impactful stories about the discoveries and ideas shaping our world today.
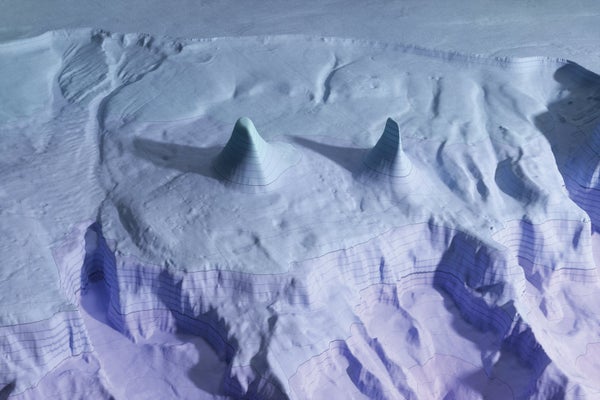

RYDER GLACIER SILL
​​​​Geologists at Stockholm University were puzzled about why the front edge of Ryder Glacier, at the Sherard Osborn Fjord, was losing less ice than the faces of other Greenland glaciers. Using multibeam sonar on an icebreaker in the fjord, they discovered two parallel sills of bedrock (red), separated by a basin, that cross the fjord. The inner sill, about 3.8 miles across and 1,600 to 1,900 feet high, blocks relatively warm Atlantic Ocean water from reaching the glacier and melting its underside, slowing the glacier’s demise.

Credit: Maciej Frolow

The goal is to collect and stitch together mapping done by governments, industries and research institutions everywhere. Public release of previously private bathymetric data is helping to widen the areas plotted. And uncrewed, remotely operated vehicles fitted with sonar that can zoom around underwater for days at a time are speeding the pace of mapping. By June 2022 an impressive 21 percent of the world's seafloor had been charted. The more experts map, the more surprises they find—such as the three unexpected, unusual formations revealed here.

Mark Fischetti has been a senior editor at Scientific American for 17 years and has covered sustainability issues, including climate, weather, environment, energy, food, water, biodiversity, population, and more. He assigns and edits feature articles, commentaries and news by journalists and scientists and also writes in those formats. He edits History, the magazine's department looking at science advances throughout time. He was founding managing editor of two spinoff magazines: Scientific American Mind and Scientific American Earth 3.0. His 2001 freelance article for the magazine, "Drowning New Orleans," predicted the widespread disaster that a storm like Hurricane Katrina would impose on the city. His video What Happens to Your Body after You Die?, has more than 12 million views on YouTube. Fischetti has written freelance articles for the New York Times, Sports Illustrated, Smithsonian, Technology Review, Fast Company, and many others. He co-authored the book Weaving the Web with Tim Berners-Lee, inventor of the World Wide Web, which tells the real story of how the Web was created. He also co-authored The New Killer Diseases with microbiologist Elinor Levy. Fischetti is a former managing editor of IEEE Spectrum Magazine and of Family Business Magazine. He has a physics degree and has twice served as the Attaway Fellow in Civic Culture at Centenary College of Louisiana, which awarded him an honorary doctorate. In 2021 he received the American Geophysical Union's Robert C. Cowen Award for Sustained Achievement in Science Journalism, which celebrates a career of outstanding reporting on the Earth and space sciences. He has appeared on NBC's Meet the Press, CNN, the History Channel, NPR News and many news radio stations. Follow Fischetti on X (formerly Twitter) @markfischetti

More by Mark Fischetti
Scientific American Magazine Vol 327 Issue 2This article was originally published with the title “Every Inch of the Seafloor” in Scientific American Magazine Vol. 327 No. 2 (), p. 40
doi:10.1038/scientificamerican0822-40