
As Douglas Adams wrote in The Hitchhiker’s Guide to the Galaxy, “Space is big.... You just won’t believe how vastly, hugely, mind-bogglingly big it is.” We and many other astronomers have dedicated our careers to creating maps of the universe on the largest scales possible—to discovering just how big the cosmos really is and how it works.
The maps we create are crucial for studying the physics that drives cosmic history. In July 2020, a 20-year project we worked on called the Sloan Digital Sky Survey produced the largest map of the cosmos ever made. It includes our immediate surroundings, the farthest reaches of space, and everything in between. This three-dimensional chart contains the positions of four million galaxies laid out like signposts over many billions of light-years, stretching back in time to some of the earliest epochs of the universe.
The map shows that galaxies are not distributed randomly. Instead they cluster in patterns: long filaments and two-dimensional sheets of galaxies in some areas; dark voids containing few galaxies in others. Scientists believe these patterns emerged before the galaxies were born, starting less than one billion years after the big bang. By mapping as much of cosmic history as possible, we can record the growth of these patterns and deduce the fundamental laws that guided their evolution. This atlas of galaxies provides crucial information in the quest to understand some of the biggest mysteries in physics, such as the geometry of the universe and the nature of the dark energy driving the accelerating expansion of space.
On supporting science journalism
If you're enjoying this article, consider supporting our award-winning journalism by subscribing. By purchasing a subscription you are helping to ensure the future of impactful stories about the discoveries and ideas shaping our world today.
Cores and Shells
The Sloan Digital Sky Survey, which uses the Sloan Foundation Telescope at Apache Point Observatory in New Mexico, included the extended Baryon Oscillation Spectroscopic Survey (eBOSS) project and its predecessor, BOSS. These efforts based their measurements on a pattern in the arrangement of galaxies throughout space called baryon acoustic oscillations (BAO). To understand this pattern, we must consider the evolution of the universe during the first 300,000 years, starting with the first fraction of a second after the big bang. At that time the universe underwent a period of rapid expansion called inflation in which the universe grew so fast that subatomic scales became the size of a golf ball in 10−32 second. During the expansion, minuscule quantum fluctuations in the distribution of energy in the universe became macroscopic in size. Regions of greater energy density gradually attracted more and more matter, leaving other areas empty. Over the next 13.7 billion years these dense spots formed the filaments, sheets and clusters of galaxies that we observe today. Astronomers call this process the growth of structure.
The BAO patterns arise because of the way light and matter interact and affect structure formation. The universe contains two kinds of matter: one that interacts with light—the regular material that we are used to dealing with in our everyday lives—and one that does not, called dark matter. In the hot and dense early universe, ordinary matter particles and particles of light (photons) bumped into one another so often that they were essentially stuck together, whereas dark matter was free to move independently. Gravity caused dark matter to cluster in the centers of dense regions, but pressure from light trying to travel outward dragged the normal matter away.
Regular matter and light went their separate ways about 300,000 years after the big bang, when the universe had expanded and cooled enough that particles spread out and photons could travel freely. That first release of light is still visible in the sky as the cosmic microwave background. Once light and matter were no longer bound, an excess of the normal matter was left in spherical shells around the overdensities of dark matter. Gravity drew both normal matter and dark matter to these structures, but the process imprinted a pattern of overly dense cores surrounded by spherical shells on the universe’s matter. This pattern, known as the baryon acoustic oscillation feature, has a size called the co-moving sound horizon and is visible in our map of galaxies.
We can use this feature as what we call a standard ruler—a handy way to measure cosmic distances. Because the patterns were all created at nearly the same time and in the same way, the cores and shells are all about the same intrinsic size—approximately 500 million light-years separate each core from its shell. But when we see these shapes in our maps, they appear smaller or larger depending on how far away they are. So if we measure their apparent size on the night sky and compare it with what we know to be their intrinsic size, we can determine their distance from Earth.
Spreading Out the Light
These standard-ruler distance calculations allow us to measure the average distance to a set of galaxies, but they do not by themselves provide cosmological information. For this we need additional information about the speed at which galaxies are moving away from us. The Sloan survey was well equipped to provide that information. In addition to capturing deep images of one third of the sky, Sloan targeted two million galaxies and quasars (galaxies dominated by a bright central black hole) through spectroscopy, a technique used to isolate the different wavelengths of light coming from an object. These spectral measurements reveal how quickly galaxies are traveling away from us, which depends on how much the universe has expanded between the time the light was emitted and when it was observed. Because this expansion stretches the wavelengths, the light becomes redder—a phenomenon called redshift.
Every BOSS and eBOSS observation captured the light spectra from 1,000 objects simultaneously, using a dedicated fiber-optic cable for each. One end of each cable was supported by an aluminum plate positioned at the focal plane of the telescope. In preparation for a night’s observation, teams prepared eight of these plates in purpose-built cartridges, with a fiber plugged by hand into each of the 1,000 holes. It took about half an hour for two technical staffers to plug a single plate. The most productive month in the history of the Sloan survey was March 2012, when we observed 103,000 spectra using these plates.
We selected the target galaxies from imaging data previously obtained by telescopes around the world. Technicians drilled holes in the aluminum plates using a computer-controlled machine at the University of Washington so that when the telescope pointed at a particular patch of the sky for its one-hour exposure, the end of a fiber inside each hole lined up perfectly with the center of its target galaxy or quasar.
Every night between December 2009 and March 2019 that the moon was not overly bright, the telescope tracked a patch of sky, and the fibers fed the light that fell onto the focal plane into two spectrographs. These modern detector cameras digitally measured the light’s intensity as a function of wavelength. With these data we could calculate each galaxy’s redshift.
During the almost 10 years that eBOSS and its predecessor BOSS collected data, we measured the locations and redshifts of more than four million galaxies. Because the light from distant galaxies takes a long time to reach the telescope, the maps from BOSS and eBOSS show us 11 billion years of cosmological time, covering most of the history of the universe.

Credit: George Retseck; Source: Anand Raichoor Swiss Federal Institute of Technology Lausanne/Lawrence Berkeley National Laboratory (step 4 map overlay)
Probing Dark Energy
By combining our redshift measurements with our distance estimates from the BAO standard ruler, we were able to study the relation between distance and redshift—in other words, how much the universe has expanded and stretched light given the distance traveled. This information shows us how the expansion of space has changed over the past 11 billion years, giving us insight into one of the biggest enigmas in physics today: dark energy.
Dark energy is the mysterious force that seems to be accelerating the expansion of the universe—a surprising phenomenon discovered in 1998. The simplest mathematical model for dark energy is the so-called cosmological constant, lambda, a term in the field equations for Einstein’s general theory of relativity that describes the energy present in empty space. This energy can act as a repelling force, pushing against the inward pull of gravity to speed up the universe’s outward expansion. Over the past 20 years this cosmological model, referred to as Lambda Cold Dark Matter (Lambda-CDM), has survived many tests; although we do not fully understand it, it is our best model.
Lambda-CDM has problems, however. Three recent observations show hints of discordance between the model and reality. The first is that measurements of the local expansion rate of space do not match up with Lambda-CDM predictions based on observations of the distant universe. The second is that observations of the cosmic microwave background suggest space might be slightly more curved than predicted by the theory of inflation. Finally, the distortion of light from distant galaxies by intervening matter seems to be weaker than expected in the Lambda-CDM model. Time will tell whether these tensions are the first signs that a new cosmological model is required or simply reflect problems with the measurements. Either way, eBOSS observations are helping to point us in the right direction.
They show, for instance, that a transition occurred when the universe was 60 percent of its current size: the expansion of space stopped decelerating and started speeding up. These findings agree with the Lambda-CDM model, which suggests that this point is when dark energy won out over the gravitational effect of matter—the latter decelerates the expansion rate.*
Another crucial part of the cosmological model is the geometry of space. The theory of inflation predicts a universe whose geometry is very close to flat. But some earlier cosmic background studies suggest that space is slightly curved. Using the eBOSS maps, we were able to improve the precision of spatial geometry measurements by a factor of 10 compared with previous observations. We found no evidence that the universe is curved, giving a boost to the standard inflation picture.
We were also able to test cosmological models by looking at how quickly structures—clusters and filaments of galaxies—formed. The redshifts we measured in our survey record the relative velocity of galaxies with respect to us, the observers, but not the cause of that movement. Most of the redshift arises because of cosmological expansion—the fact that all objects in space are moving away from one another—but it is also partly caused by the growth of structure. As galaxies fall into clusters and away from voids, their velocities, and therefore their redshifts, change.
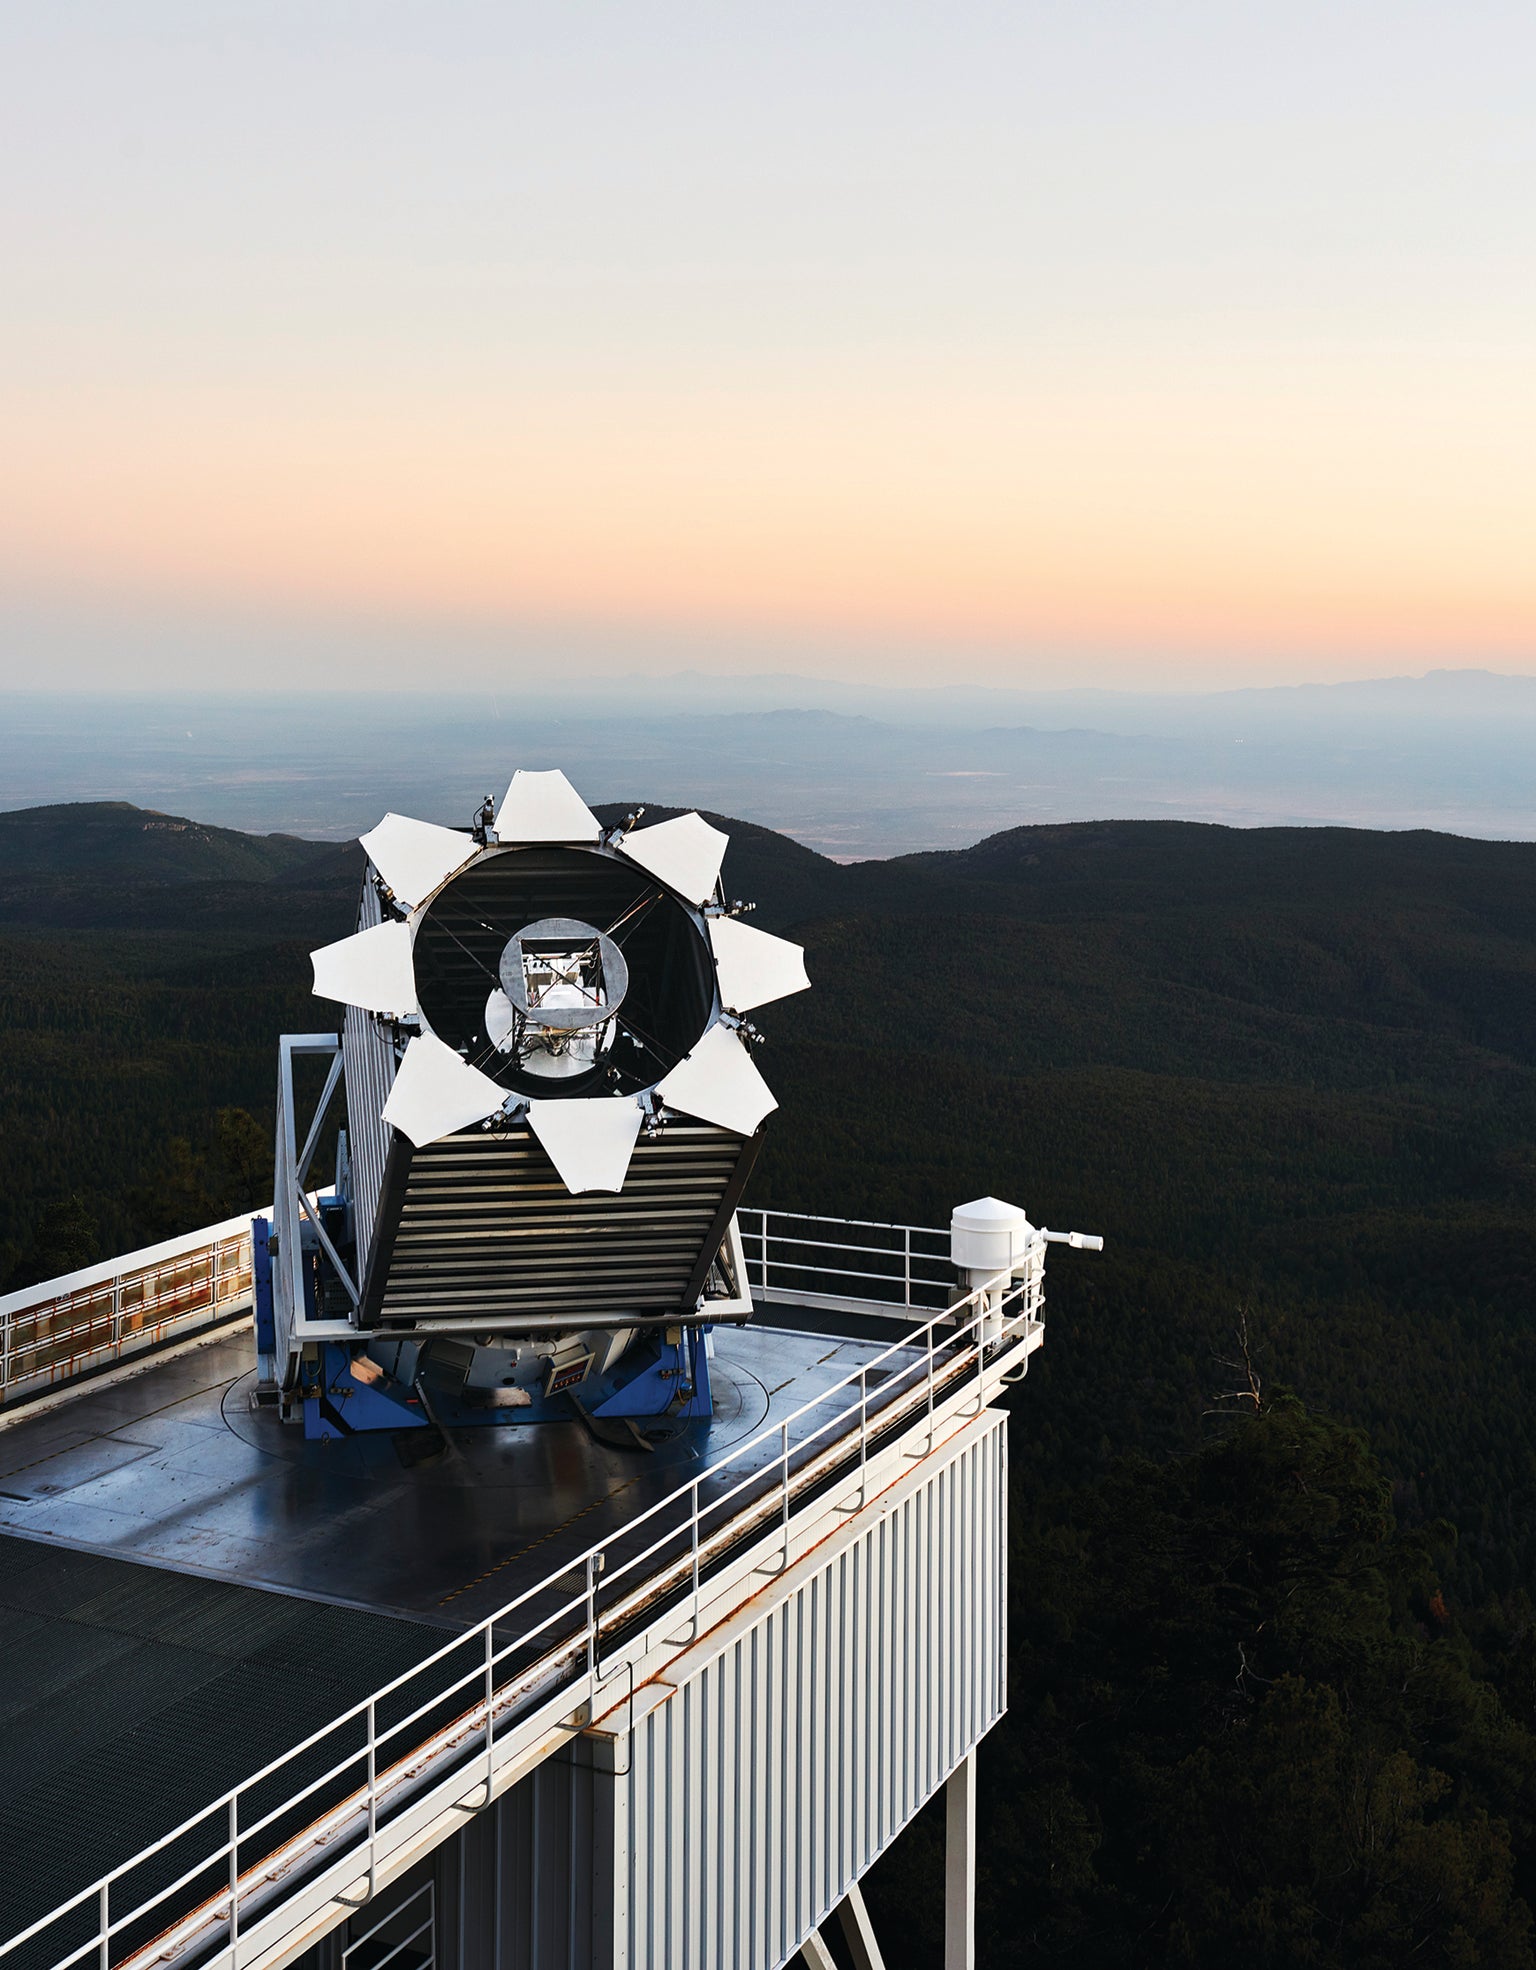
IN 2000 the Sloan Foundation 2.5-meter Telescope in New Mexico began the Sloan Digital Sky Survey’s two-decade mapping effort. Credit: Enrico Sacchetti Science Source
The velocities affected by structure growth, called redshift-space distortions, are apparent when we compare the patterns seen along and across the line of sight with the galaxies. The size of the redshift-space distortions tells us the rate at which structures grow. Using data from eBOSS and its predecessors, we calculated this rate to a precision of about 3.5 percent. Our result matches the predictions of general relativity, which is important because several previous measurements that relied on different methods have values that are about 10 percent lower.
Overall there is no evidence from our measurements that the standard cosmological model with lambda, the cosmological constant, is wrong. We see no surprises in structure growth, the nature of dark energy or the geometry of space. We do, however, see the same discrepancy we mentioned earlier between the expansion rate of space based on data from the local universe and that derived from the cosmic microwave background. Measurements based on the latter, for example, find an expansion rate of 67.28 ± 0.61 kilometers per second per megaparsec (a measurement of distance in space), whereas local measurements of supernovae lead to values 10 percent higher. Using our BAO measurements, we estimate an expansion rate of about 67 km/s/Mpc—both when we combine our numbers with cosmic background data and when we do not. The difference between this value and the rate astronomers get when they look only at the nearby universe is getting significant enough to call into question the basic assumptions of our cosmological model. There may still be a problem with one or more of the measurements that feed into these calculations, but it is at least equally likely that we need to revise the model for the early expansion of the universe and the co-moving sound horizon. We may need to introduce a new kind of particle, field or interaction to explain the dissonance we see.
Bigger and Better
Over the past 20 years the Sloan telescope and spectrographs have led the world in performing galaxy redshift surveys, culminating in eBOSS. The Sloan survey will continue with new maps of stars and quasars, and our success has inspired astronomers to plan even larger galaxy surveys covering a wider range of cosmic history. One such project, which has begun early science operations, is called the Dark Energy Spectroscopic Instrument (DESI). This survey will use a 5,000-fiber multiobject spectrograph located on the Mayall Telescope at Kitt Peak National Observatory in Arizona to create a deeper and denser map of the universe. The new spectrograph is capable of observing 5,000 targets simultaneously and is positioned on a telescope that has a primary mirror with a diameter approximately twice that of the Sloan telescope’s. Rather than relying on humans, each of the 5,000 fibers will be placed into position by a dedicated robot. In five years DESI will create a galaxy survey that is more than 10 times larger than Sloan’s.
Set to launch in 2022, the satellite mission Euclid, led by the European Space Agency, will also perform a large galaxy redshift survey. Using its space-based perspective to avoid the fuzziness introduced by Earth’s atmosphere, Euclid will look at higher redshifts—that is, greater distances—than can be seen clearly from the ground. It will measure redshifts for approximately 25 million galaxies. In addition to DESI and Euclid, plans are afoot to build larger multiobject spectrographs on grander, 10-meter-class telescopes, which should enable a significant leap forward in our understanding of the universe.
*Editor’s Note (4/26/21): This sentence was revised after posting to correct the description of how dark energy and the gravitational effect of matter change the rate of expansion.